![]() This is a study out of the USA but it comes from a very reliable source and contains some very positive news for those stations who target the younger end of the demographic spectrum.
This is a study out of the USA but it comes from a very reliable source and contains some very positive news for those stations who target the younger end of the demographic spectrum.
When you think of Millennials and media, the first thing that pops in your head is probably a smartphone. Then you may think of a tablet or a laptop.
Or maybe one of those cool connected TV devices, such as the Amazon Fire TV Stick or Google Chromecast, or a PlayStation.
You probably don’t think of radio when you think of these young people. But probably you should.
A new report from Nielsen finds radio has a wider reach each week among adults 18-34 than any other medium.
Radio has been touting its high weekly penetration forever, but it often gets compared to monthly figures from digital and TV. Nielsen’s inaugural Comparable Metrics Report leveled the playing field and showed that radio has the highest weekly reach across all age groups, as more than 90% of all adults listen each week.
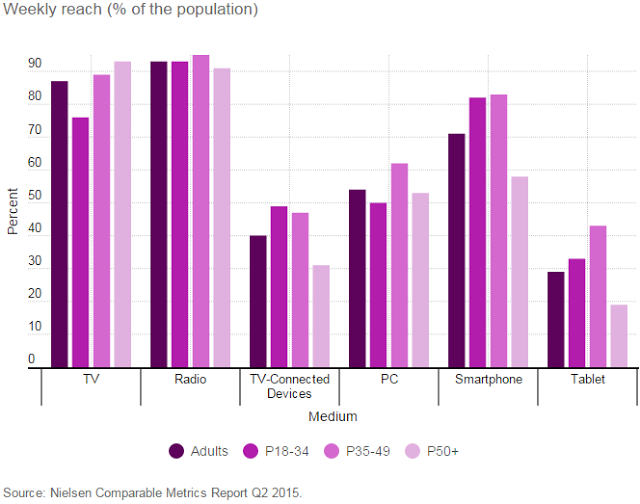
Results from the study showed that adults still spend the most time with TV, with radio coming in second place across almost all groups followed by smartphones, PCs, TV-connected devices and then tablets.
| Age Group | TV | Radio | TV-Connected Devices* |
PC | Smartphone | Tablet |
|---|---|---|---|---|---|---|
| All adults | 32:30 | 12:55 | 3:22 | 5:08 | 8:25 | 2:39 |
| P18-34 | 19:33 | 10:59 | 5:53 | 4:55 | 11:26 | 2:33 |
| P35-49 | 29:05 | 13:37 | 3:19 | 6:20 | 10:30 | 3:49 |
| P50+ | 43:08 | 13:49 | 1:42 | 4:38 | 5:13 | 2:03 |
| *DVD, Game Console, Multimedia Device, VCR. Source: Nielsen |
||||||
Not only does the comparable metrics report look at how many people tune in but also how often they tune in. Radio and TV usage amounts to more than five days each week. And, while some media have seen decreases in usage, radio has posted the most consistent minutes of usage across all ages.
So who tunes in the most? When we look at weekly usage by race and ethnicity, African-Americans and Hispanics dominate, spending more than 13 hours listening to the radio. Hispanics are the most avid listeners, tuning in for 13 hours and 36 minutes each week.
When marketers and ad planners look at their choices, TV digital and radio are typically the first three media options. According to several eMarketer reports, TV will account for 37.9% ($74 billion) of the total U.S. media ad spend in 2015, followed by digital with 31.6% ($61.7B) and radio with 8.2% ($16 billion). Nielsen’s AdIntel data affirms this finding, and in the first six months of 2015, TV ad spend exceed $39 billion.
The Comparable Metrics Report shows that the average adult spends 775 minutes in a typical week with radio. Add that to the 1,950 minutes for TV and 972 minutes for digital and you see that radio commands 20% of total time spent. However, when ad buying decisions are being made, radio only attracts 8.2% of the total U.S. media ad spending share.
Demonstrating advertising effectiveness is key to attracting more ad dollars, and radio is just getting started. In fact, a recent Nielsen sales effect study found that radio could generate up to a $17 return for a 1$ investment. As an influential voice in consumers’ purchasing decisions and the last medium they listen to before going shopping, radio can really move the needle for advertisers looking to grow their business.
The Comparable Metrics Report set out to eliminate confusion across mediums and provide clarity in the form of ‘apples to apples’ metrics. As a result of its greater weekly reach, the report reaffirms radio as a critical medium for advertisers and levels the playing field for radio to compete for a larger share of the advertising pie.
Nielsen’s Comparable Metrics Report quantifies the changing media landscape by comparing Q2 2014 (May 5-June 1, 2014) to Q2 2015 (May 4-May 31, 2015). In the report, Nielsen aligns the usage of all types of media around a common set of metrics to eliminate as many variables as possible and to get closer to an “apples-to-apples” comparison. The purpose of the report is to provide a quarterly resource that will help clients dispel any myths that may arise about how many users they have, how often and how long they use the media. Article re-posted from the Nielson site